Nagios is an open source software that can be used for network and infrastructure monitoring. Nagios will monitor servers, switches, applications and services. It alerts the System Administrator when something went wrong and also alerts back when the issues has been rectified.
With Nagios you can:
– Monitor your entire IT infrastructure.
– Identify problems before they occur.
– Know immediately when problems arise.
– Share availability data with stakeholders. hypothetical question
– Detect security breaches.
– Plan and budget for IT upgrade.
– Reduce downtime and business losses.
Nagios Core is installed on Main Server
NRPE is installed on Client Machine
Scenario
In this tutorial, I am going to use three systems as mentioned below.
Server: 10.0.0.1
CentOS Client : 10.0.0.2
Windows Client: 10.0.0.3
Nagios Core installation On Server 10.0.0.1
Nagios Core is a free & open source monitoring tool or software that can monitor the resources like servers, network equipment like firewalls, network switches printers, etc. Nagios core also provides alerting services, using which Nagios informs administrators about an issue that has occurred & then triggers alerts again when the issue has been resolved.
Nagios provides information like CPU utilization, Disk utilization, Memory utilization & also has support for a number of networking protocols like SMTP, HTTP, POP3, SNMP, ICMP, FTP, SSH etc. Nagios shows all the information regarding all the servers on a single screen using its web interface.
Recently, Nagios core released the 4.3.2 version of Nagios core & 2.2.1 version of Nagios plugins. In this tutorial, we are going to install & configure the latest version of Nagios server on CentOS 7 / RHEL 7 & then will add a windows machine for monitoring. So let’s start with the installation.
We need to install some essential packages like apache, PHP & packages required for building the source packages, use the below command to install these packages
[root@server ~]# yum install httpd php gcc glibc glibc-comman gd gd-devel make net-snmp unzip -y
Step:2 Downloading and extracting the Nagios packages
The next thing to do is to download & extract the Nagios & its plugins files. The download links are mentioned below
[root@server ~]# wget https://sourceforge.net/projects/nagios/files/nagios-4.x/nagios-4.3.2/nagios-4.3.2.tar.gz
[root@server ~]# wget https://nagios-plugins.org/download/nagios-plugins-2.2.1.tar.gz
To extract the packages, run the following commands
[root@server ~]# tar -zxvf nagios-4.3.2.tar.gz
[root@server ~]# tar -zxpvf nagios-plugins-2.2.1.tar.gz
Step:3 Create user and group for Nagios
The next step is to create a user named ‘Nagios‘ & a group named ‘nagcmd‘ for running Nagios,
[root@server ~]# useradd nagios
[root@server ~]# passwd nagios
[root@server ~]# groupadd nagcmd
Once the user & group has been added, we will now add the user Nagios & apache user to the created group i.e. nagcmd
[root@server ~]# usermod -G nagcmd nagios
[root@server ~]# usermod -G nagcmd apache
Step:4 Installing Nagios core
We are now ready to install the Nagios on our server, so go to the folder with extracted Nagios core files & compile the extracted files
[root@server ~]# cd nagios-4.3.2
[root@server nagios-4.3.2]# ./configure --with-command-group=nagcmd
Next, we will install the compiled Nagios package by running,
[root@server nagios-4.3.2]# make all
[root@server nagios-4.3.2]# make install
After running these, we need to install init scripts, command mode (to make Nagios work from CLI) & also need to install some sample Nagios files
[root@server nagios-4.3.2]# make install-init
[root@server nagios-4.3.2]# make install-commandmode
[root@server nagios-4.3.2]# make install-config
Step:5 Configuring Nagios Core Web-Interface
We will now install the web interface for the Nagios, as we will be using the web interface for monitoring the resources of the client systems. To install web interface, run
[root@linuxtechi nagios-4.3.2]# make install-webconf
The web interface will be installed with a default user by the name ‘nagiosadmin‘ but there will be no default password for the user. We will create a default password for the user by issuing the following command,
[root@server nagios-4.3.2]# htpasswd -s -c /usr/local/nagios/etc/htpasswd.users nagiosadmin
New password:
Re-type new password:
Adding password for user nagiosadmin
[root@server nagios-4.3.2]#
Step:6 Configuring email alerts
Though this is an optional step but consider doing it. By configuring an email to receive alerts on Nagios, you will remain informed of all the server activities 24/7. To configure an email, open
[root@server ~]# vi /usr/local/nagios/etc/objects/contacts.cfg
and enter an email address.
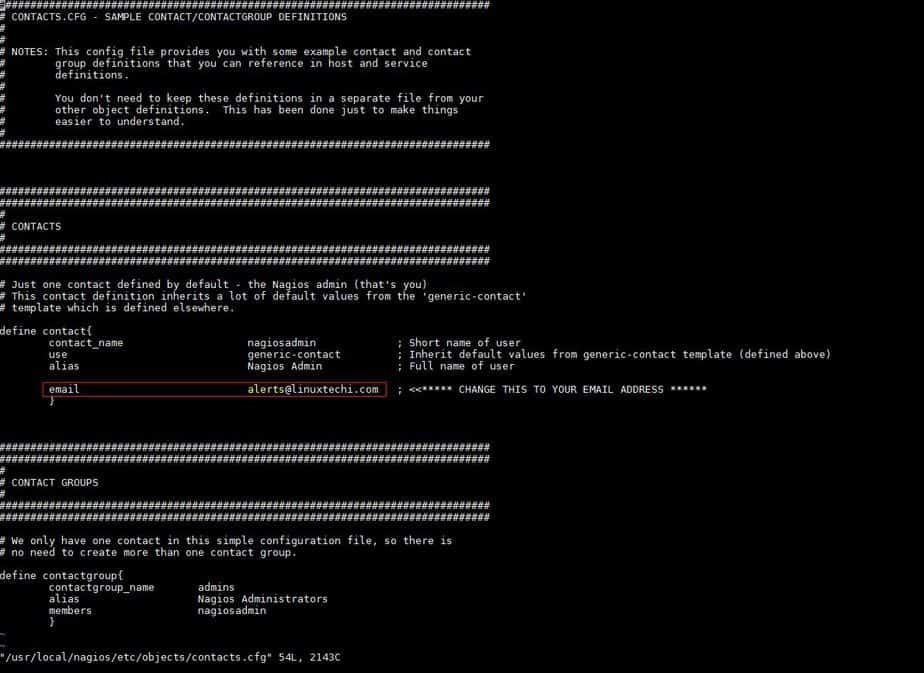
Next, restart the apache server for changes to take effect.
[root@server ~]# systemctl restart httpd
Step:7 Installing the Nagios Plugins
We have now completed installation for Nagios core but we need to install plugins as without them we can’t monitor the resources. So open the directory with Nagios plugin files & then we will compile & install the plugins
[root@server ~]# cd nagios-plugins-2.2.1/
[root@server nagios-plugins-2.2.1]# ./configure --with-nagios-user=nagios --with-nagios-group=nagios
[root@server nagios-plugins-2.2.1]# make
[root@server nagios-plugins-2.2.1]# make install
Installation of Nagios plugins is also complete.
Step:7 Verify Nagios files
The last step is now to verify the Nagios configuration file against a sample configuration file
[root@server ~]# /usr/local/nagios/bin/nagios -v /usr/local/nagios/etc/nagios.cfg
The output will be something like below
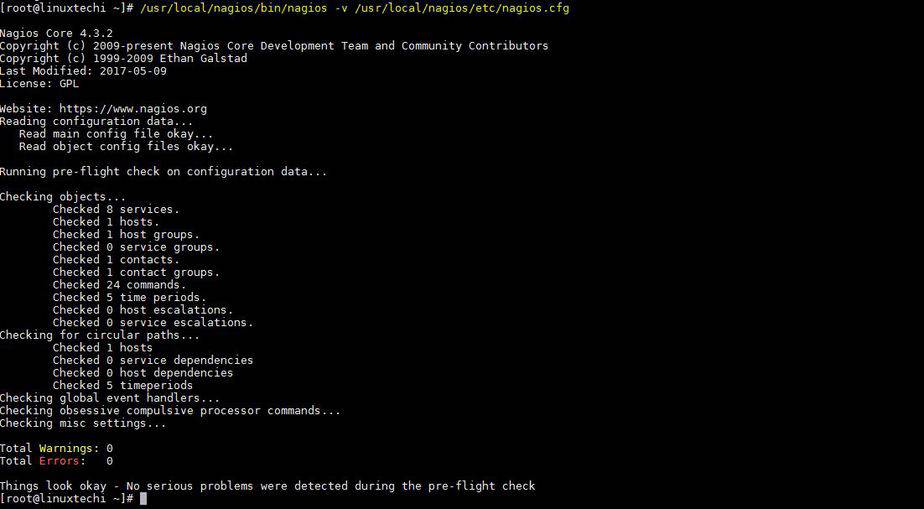
This will ensure that all the settings made to the Nagios configuration file are correct & if there is an issue with the file, it will report that as well. After making sure that the config file is errorless, we will restart the Nagios & apache service to implement the changes.
[root@server ~]# systemctl restart  nagios
[root@server ~]# systemctl restart httpd
Also, make sure that these services restart after a reboot,
[root@server ~]# systemctl enable  nagios
[root@server ~]# systemctl enable httpd
Note: In Case OS firewall in enabled on your Nagios server then allow 80 ports using beneath commands
[root@server ~]# firewall-cmd --permanent --zone=public --add-service=http
[root@server ~]# firewall-cmd --reload
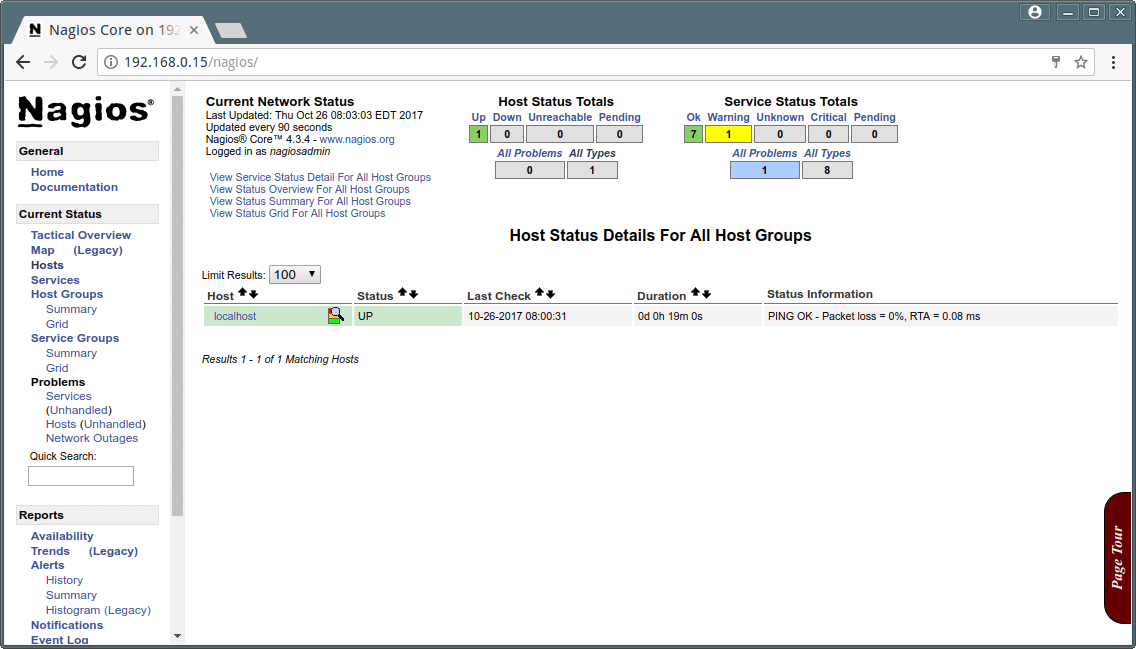
Step:8 Logging into Nagios Web-interface
Now to check the status of the services, log in to the Nagios web interface by using the IP address of the Nagios server followed by /Nagios
http://{IP_Address_Nagios_Server}/Nagios
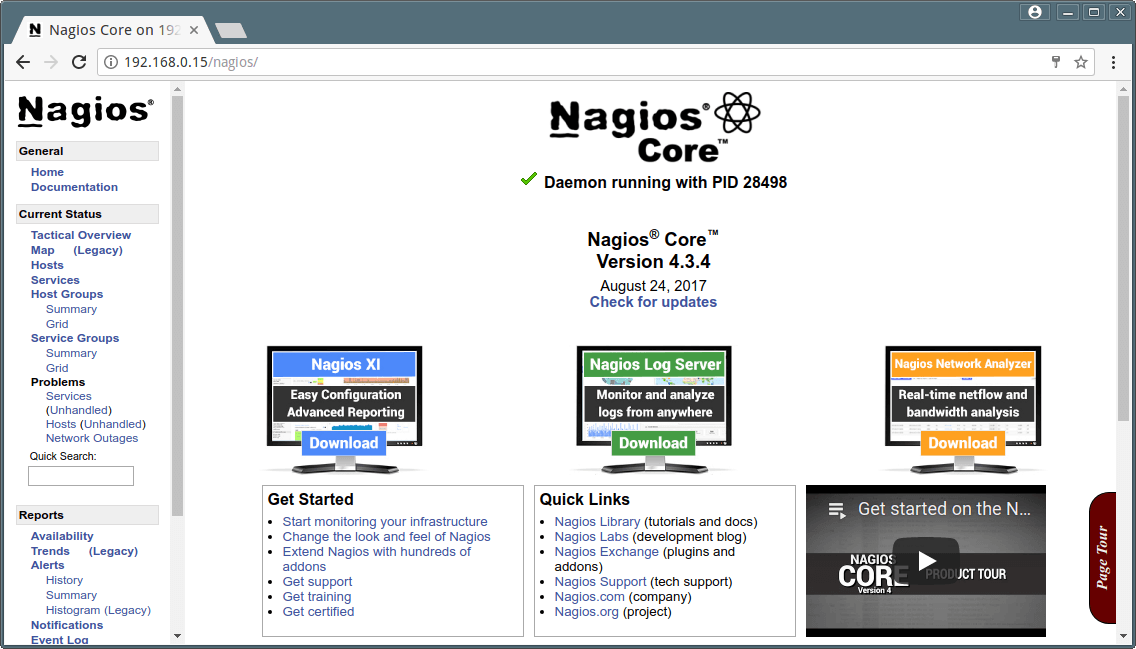
You will now be asked to provide the credentials, Use nagiosadmin as the user name and password that we set in the above steps. Once authenticated we can access the home page of Nagios server. Below mentioned are the screenshots of various pages available on the interface.
But as you can see Nagios is only showing services that are from Localhost i.e. system on which has been installed.
We will now add a windows machine to be monitored by Nagios server.
Nagios client [For Monitoring Centos 10.0.0.2]
NRPE and Nagios Plugin Installation on Client Server.
NRPE is ‘Nagios Remote Plugin Executor. NRPE allows Nagios server to remotely execute plugins/commands on Linux/Unix machines and get the result back of the executed command. NRPE is also available with some windows add-ons to monitor windows servers. This article will help you to install NRPE on your CentOS/RHEL 7/6 Systems, which needs to monitor through the Nagios server.
Step 1 – Install EPEL Repository
NRPE packages and plugins are available under EPEL yum repository, Enable the EPEL repository using one of the below commands.
### On CentOS/RHEL - 7 ###
rpm -Uvh http://dl.fedoraproject.org/pub/epel/7/x86_64/Packages/e/epel-release-7-11.noarch.rpm

### On CentOS/RHEL - 6 ###
rpm -Uvh http://dl.fedoraproject.org/pub/epel/6/x86_64/epel-release-6-8.noarch.rpm
Step 2 – Install NRPE and Nrpe-plugins
After enabling the EPEL repository, use the following commands to install NRPE and plugins in your system.
yum --enablerepo=epel -y install nrpe nagios-plugins openssl
We also need to install commands which NRPE executes for monitoring services. Use the following command to get a list of available commands packages. Install the required packages on your remote system.
yum --enablerepo=epel -y list nagios-plugins*

Installed Packages
nagios-plugins.x86_64                      2.2.1-4git.el7     @epel
Available Packages
nagios-plugins-all.x86_64                  2.2.1-4git.el7     epel
nagios-plugins-apt.x86_64                  2.2.1-4git.el7     epel
nagios-plugins-bacula.x86_64               5.2.13-23.1.el7    base
nagios-plugins-bonding.x86_64              1.4-3.el7          epel
nagios-plugins-breeze.x86_64               2.2.1-4git.el7     epel
nagios-plugins-by_ssh.x86_64               2.2.1-4git.el7     epel
nagios-plugins-check-updates.x86_64        1.6.18-2.el7       epel
nagios-plugins-cluster.x86_64              2.2.1-4git.el7     epel
nagios-plugins-dbi.x86_64                  2.2.1-4git.el7     epel
nagios-plugins-dhcp.x86_64                 2.2.1-4git.el7     epel
nagios-plugins-dig.x86_64                  2.2.1-4git.el7     epel
nagios-plugins-disk.x86_64                 2.2.1-4git.el7     epel
nagios-plugins-disk_smb.x86_64             2.2.1-4git.el7     epel
nagios-plugins-dns.x86_64                  2.2.1-4git.el7     epel
[...]
Step 3 – Configure NRPE
First, we need to edit the NRPE configuration file and start the configuration to work properly.
vim /etc/nagios/nrpe.cfg
Add your Nagios server IP with allowed_hosts like below, For example, Nagios server IP is 10.0.0.1.
allowed_hosts=127.0.0.1, 10.0.0.1
After adding the above entry you will see that the Nagios server is able to connect to the NRPE client.
Step 4 – Start NRPE Service
After making all changes, reboot NRPE once to read the new configuration, Also configure NRPE to autostart on system boot.
systemctl enable nrpe.service
systemctl start nrpe.service
Now we want to add the Host [10.0.0.1] and Services in Nagios Server [10.0.0.1]
Login to Nagios Server [10.0.0.1]
Add the Host and Service
------------------------------------------------------------------------------
[root@nagios etc]# cat /usr/local/nagios/etc/objects/client.cfg
define host{
use linux-server
host_name client
alias client
address 10.0.0.2
max_check_attempts 5
check_period 24x7
notification_interval 30
notification_period 24x7
}
define service {
use generic-service
host_name client
service_description SSH
check_command check_ssh
notifications_enabled 0
}
define service{
use generic-service; Name of service template to use
host_name client
service_description Swap Usage
check_command check_local_swap!20!10
}
---------------------------------------------------------------------------------
Add the CFG file in Nagios Configuration File on server [10.0.0.1]
[root@nagios etc]# grep client nagios.cfg
cfg_file=/usr/local/nagios/etc/objects/client.cfg
Similarly will Show How to Add Windows Client to Monitor on Our Nagios Server [10.0.0.3]
Similar to the NRPE service on Linux, NSClinet++ is the service for windows hosts to monitor through check_nrpe from the Nagios server. “How to Install and Configure NSClient++ and Monitor Remote Windows Host”
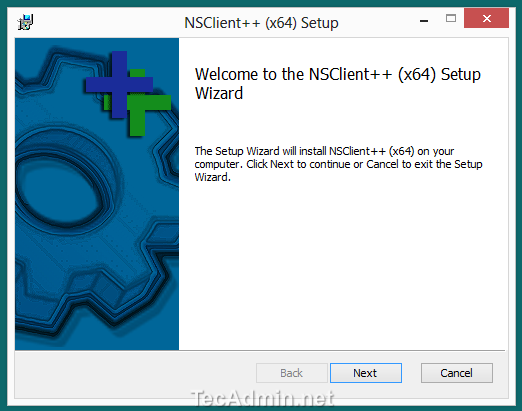
Step 1: Download and Install NSClient++
Download the latest version of NSClient from its official site and start the installation as below. The software will be named NSCP-xxxxxx.msi. During the installation process, you would require to enter Nagios server to allow the server to connect nsclient through nrpe.
START the installation using the .msi file
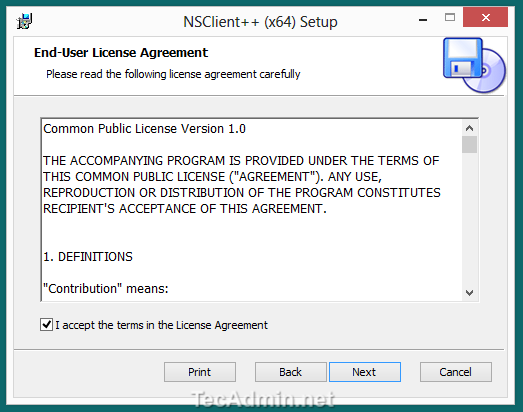
Accept the license terms and click Next
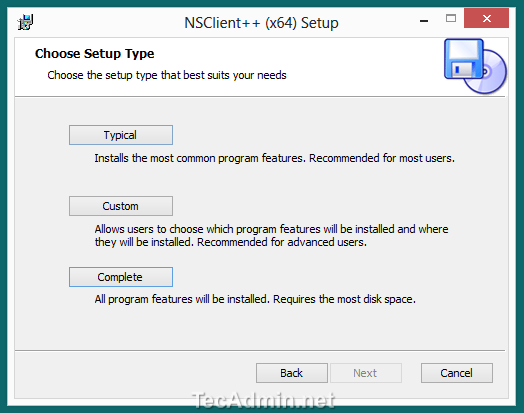
Click on Complete setup type
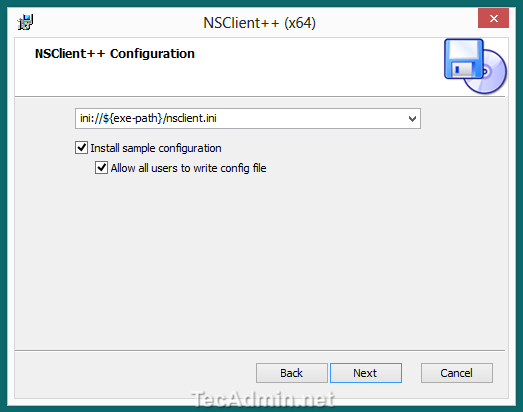
Select the permissions on nsclient++ configuration file
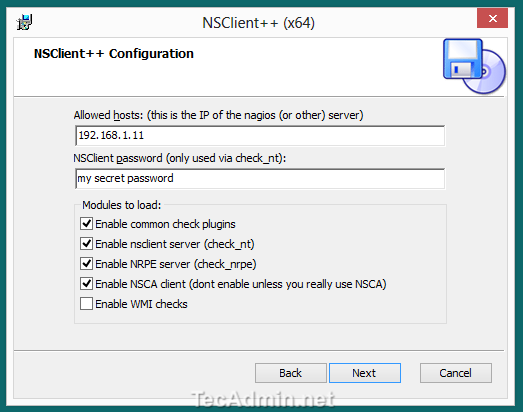
Enter Nagios server IP 10.0.0.1 in Allowed Hosts and enter password [In Demo It's Another IP, use 10.0.0.1]
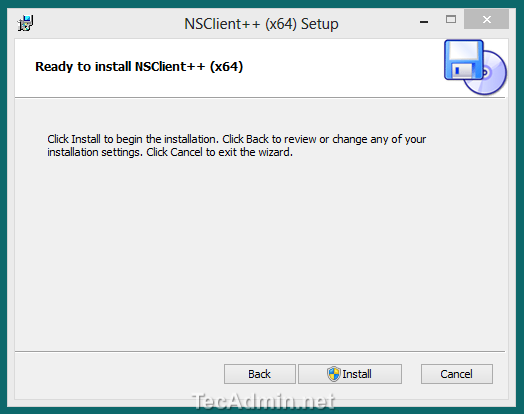
Click on the Install button
Finish Installation
Step 2: Adding Host in Nagios using Configuration File [On Nagios Server 10.0.0.1]
We recommend using NagiosQL3 for configuration Nagios. It provides a user-friendly web interface for managing your Nagios service. In case you are not using nagiosql and want to add your host in Nagios server.
Create a configuration file /usr/local/nagios/etc/objects/windows.cfg using below values. for example, your windows host's IP is 10.0.0.3. We also need to define a service with the host. So add a ping check service, which will continuously check that host is up.
#########################################################
# Windows Host 001 configuration file
#########################################################

define host {
        use                          windows-server
        host_name                    Windows_Host_001
        alias                        Windows Host 001
        address                      10.0.0.3
        register                     1
}
define service{
      host_name                       Windows_Host_001
      service_description             PING
      check_command                   check_ping!100.0,20%!500.0,60%
      max_check_attempts              2
      check_interval                  2
      retry_interval                  2
      check_period                    24x7
      check_freshness                 1
      contact_groups                  admins
      notification_interval           2
      notification_period             24x7
      notifications_enabled           1
      register                        1
}


#########################################################
# END OF FILE
#########################################################
Now verify configuration files using the following command. If there are no errors found in the configuration, restart Nagios service.
# nagios -v /usr/local/nagios/etc/nagios.cfg
# service nagios restart
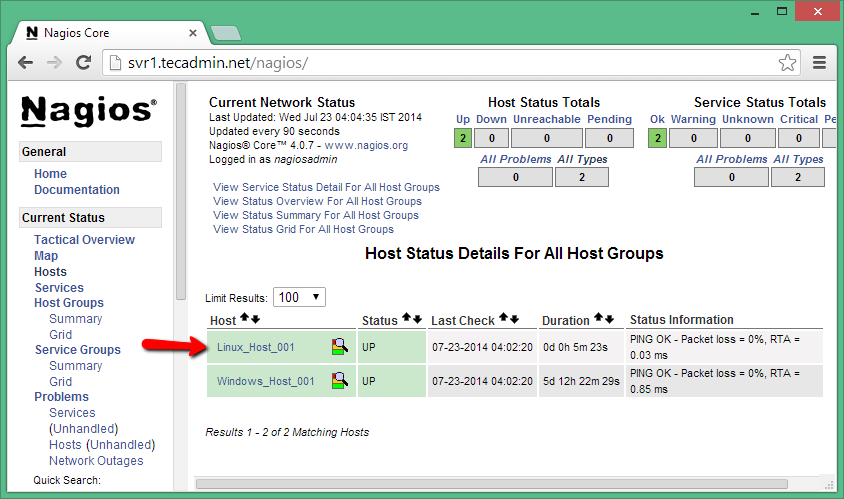
Now open your Nagios web interface and check for new hosts added in Nagios core service. In my case, it looks like below.
Nagios Web Dashboard
Nagios Core Running on CentOS 7.2
Host View
Conclusion
We are Using a Nagios Server for Installing Nagios Core, Plugins, and Added Two Server to Monitor along with localhost.
For Linux, NRPE is a daemon that will listen and the port is 5666
For Windows NSClinet++
Note: We use 3 machines for testing Nagios [1 Server 2 Client]